
One of the most important aspects of Salesforce administration is creating and managing reports. Reports provide valuable insights into business operations, allowing managers to make data-driven decisions and track progress towards goals.
In this article, we will explore all types of Salesforce reports and their use cases in various business areas.
There are 4 types of reports that can be generated in Salesforce:
- tabular reports,
- summary reports,
- matrix reports,
- joined reports.
Let’s observe all types of reports.
Tabular Reports and Their Use Cases
Tabular reports are the simplest and most common type of report in Salesforce. They display data in a table format with rows and columns. Tabular reports are useful for displaying data that needs to be sorted, summarized, or filtered. For example, a sales manager may use a tabular report to display the sales data for each sales representative in their team.
Tabular reports can be helpful in many different business scenarios to view:
- all closed won opportunities in a given time period, grouped by opportunity owner
- all open support cases, grouped by severity, and sorted by age.
- employees, grouped by department and sorted by hire date.
- leads generated by a recent campaign, grouped by source, and sorted by conversion rate.
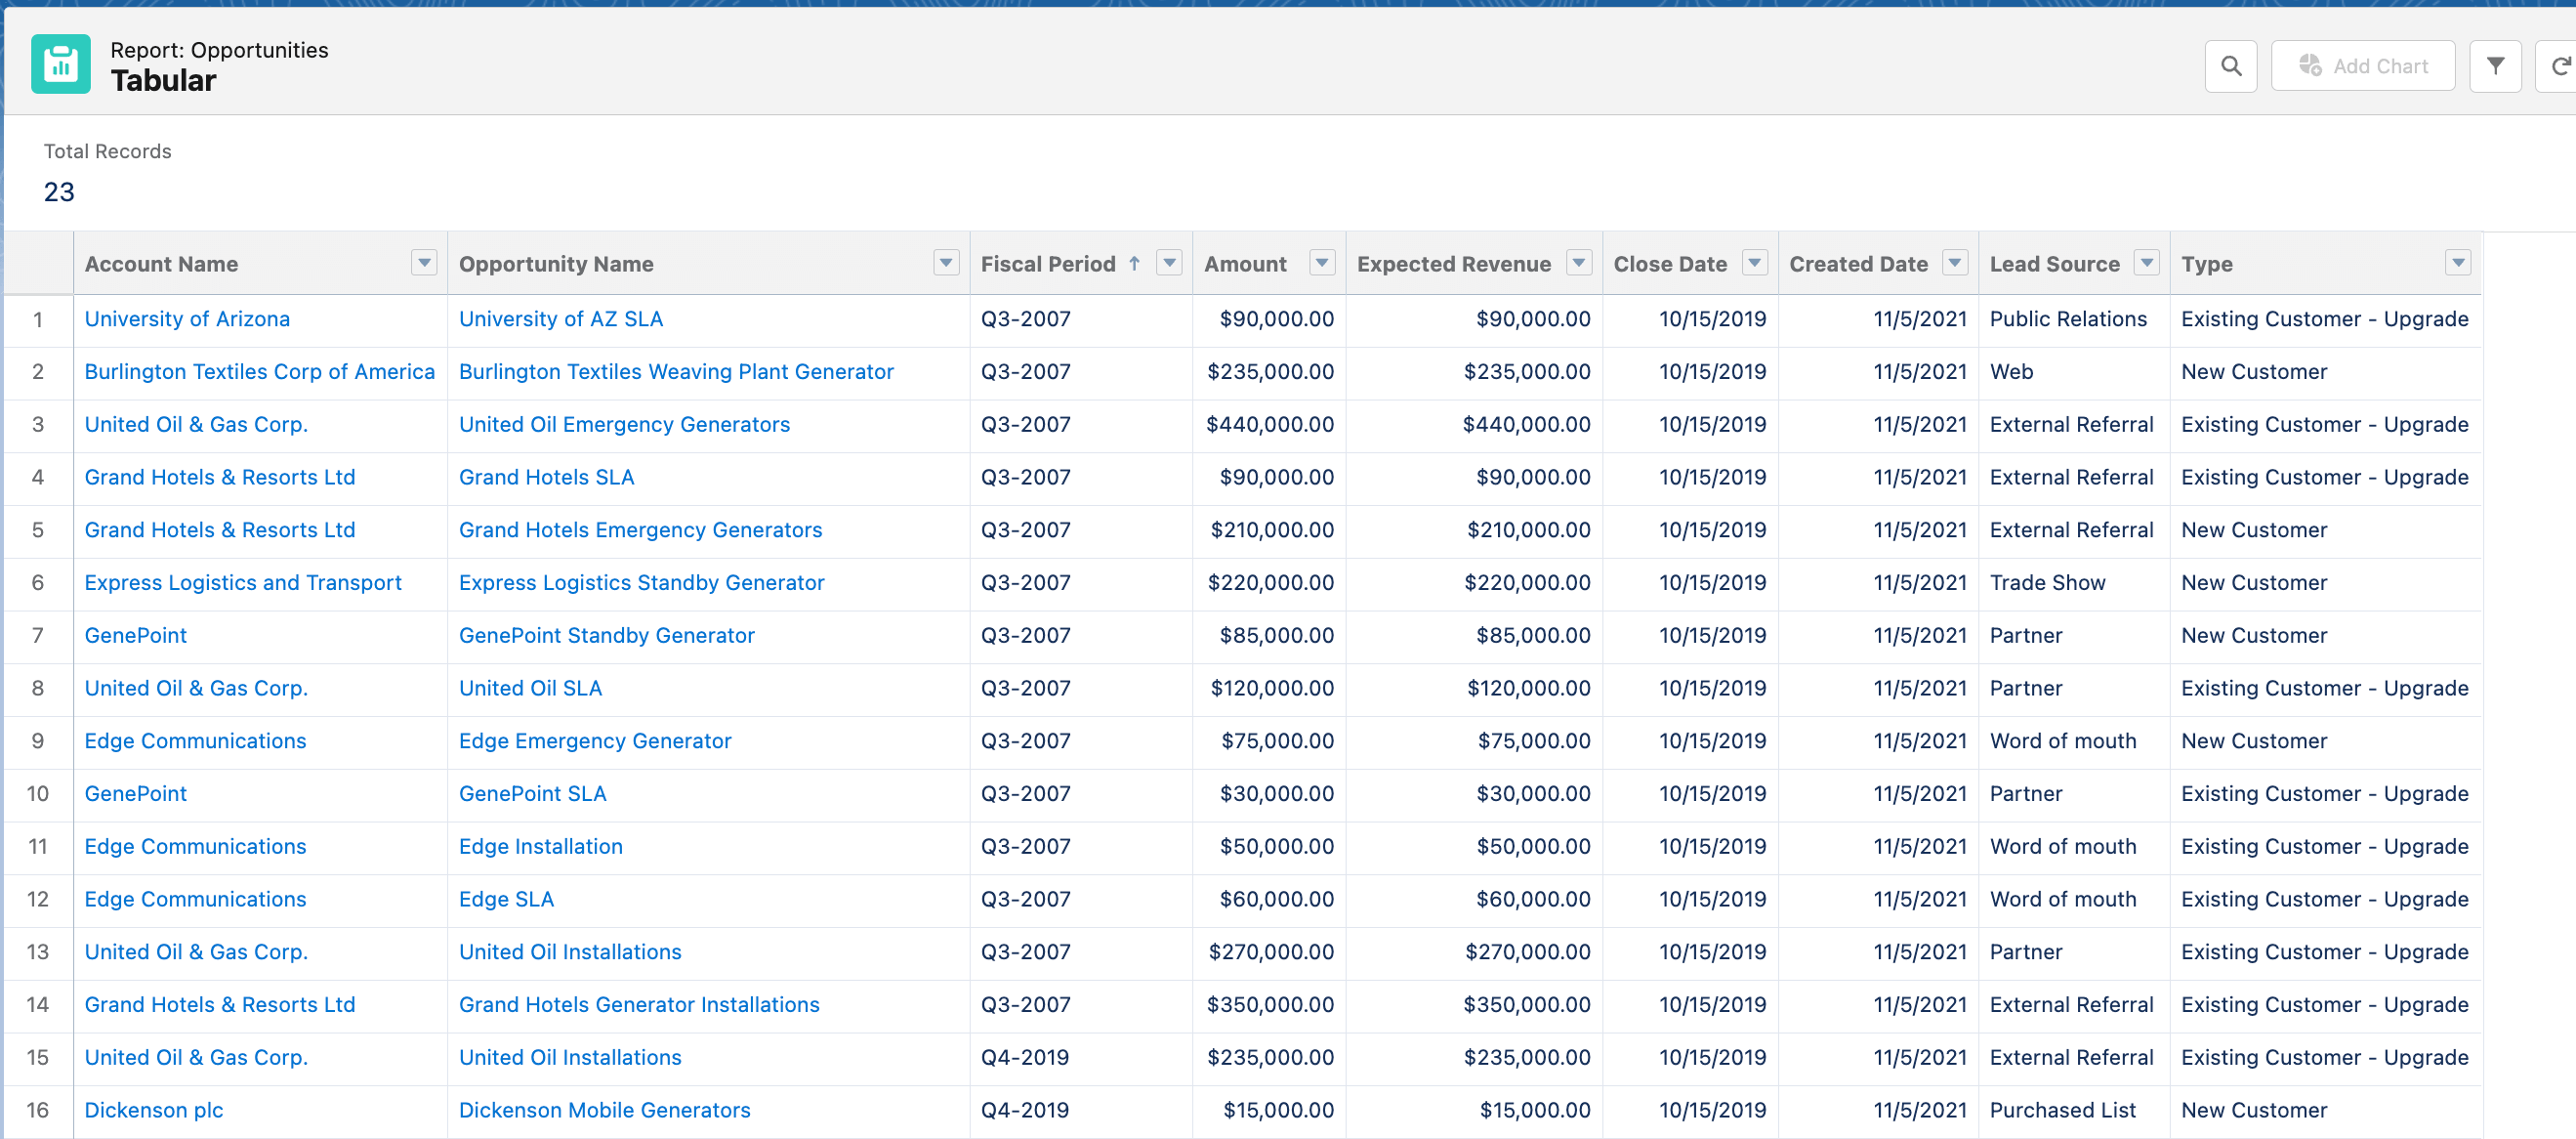
The example of the Tabular report. Click here to view the full report
Summary Reports and Their Use Cases
The second report format is a Summary report. It’s similar to Tabular but it allows group rows of data, view subtotals, and create charts. A summary report gives us many more options for organizing the data, it’s usually used when subtotals are needed based on the value of a particular field or when you want to create a hierarchically grouped report.
You should consider using summary reports to:
- summarize sales data by region, product, or sales rep
- track the progress of deals through the sales pipeline
- track the performance of sales reps or teams over time
- analyze marketing campaign data, such as lead sources, conversion rates, and ROI
- summarize financial data, such as revenue, expenses, and profit margins
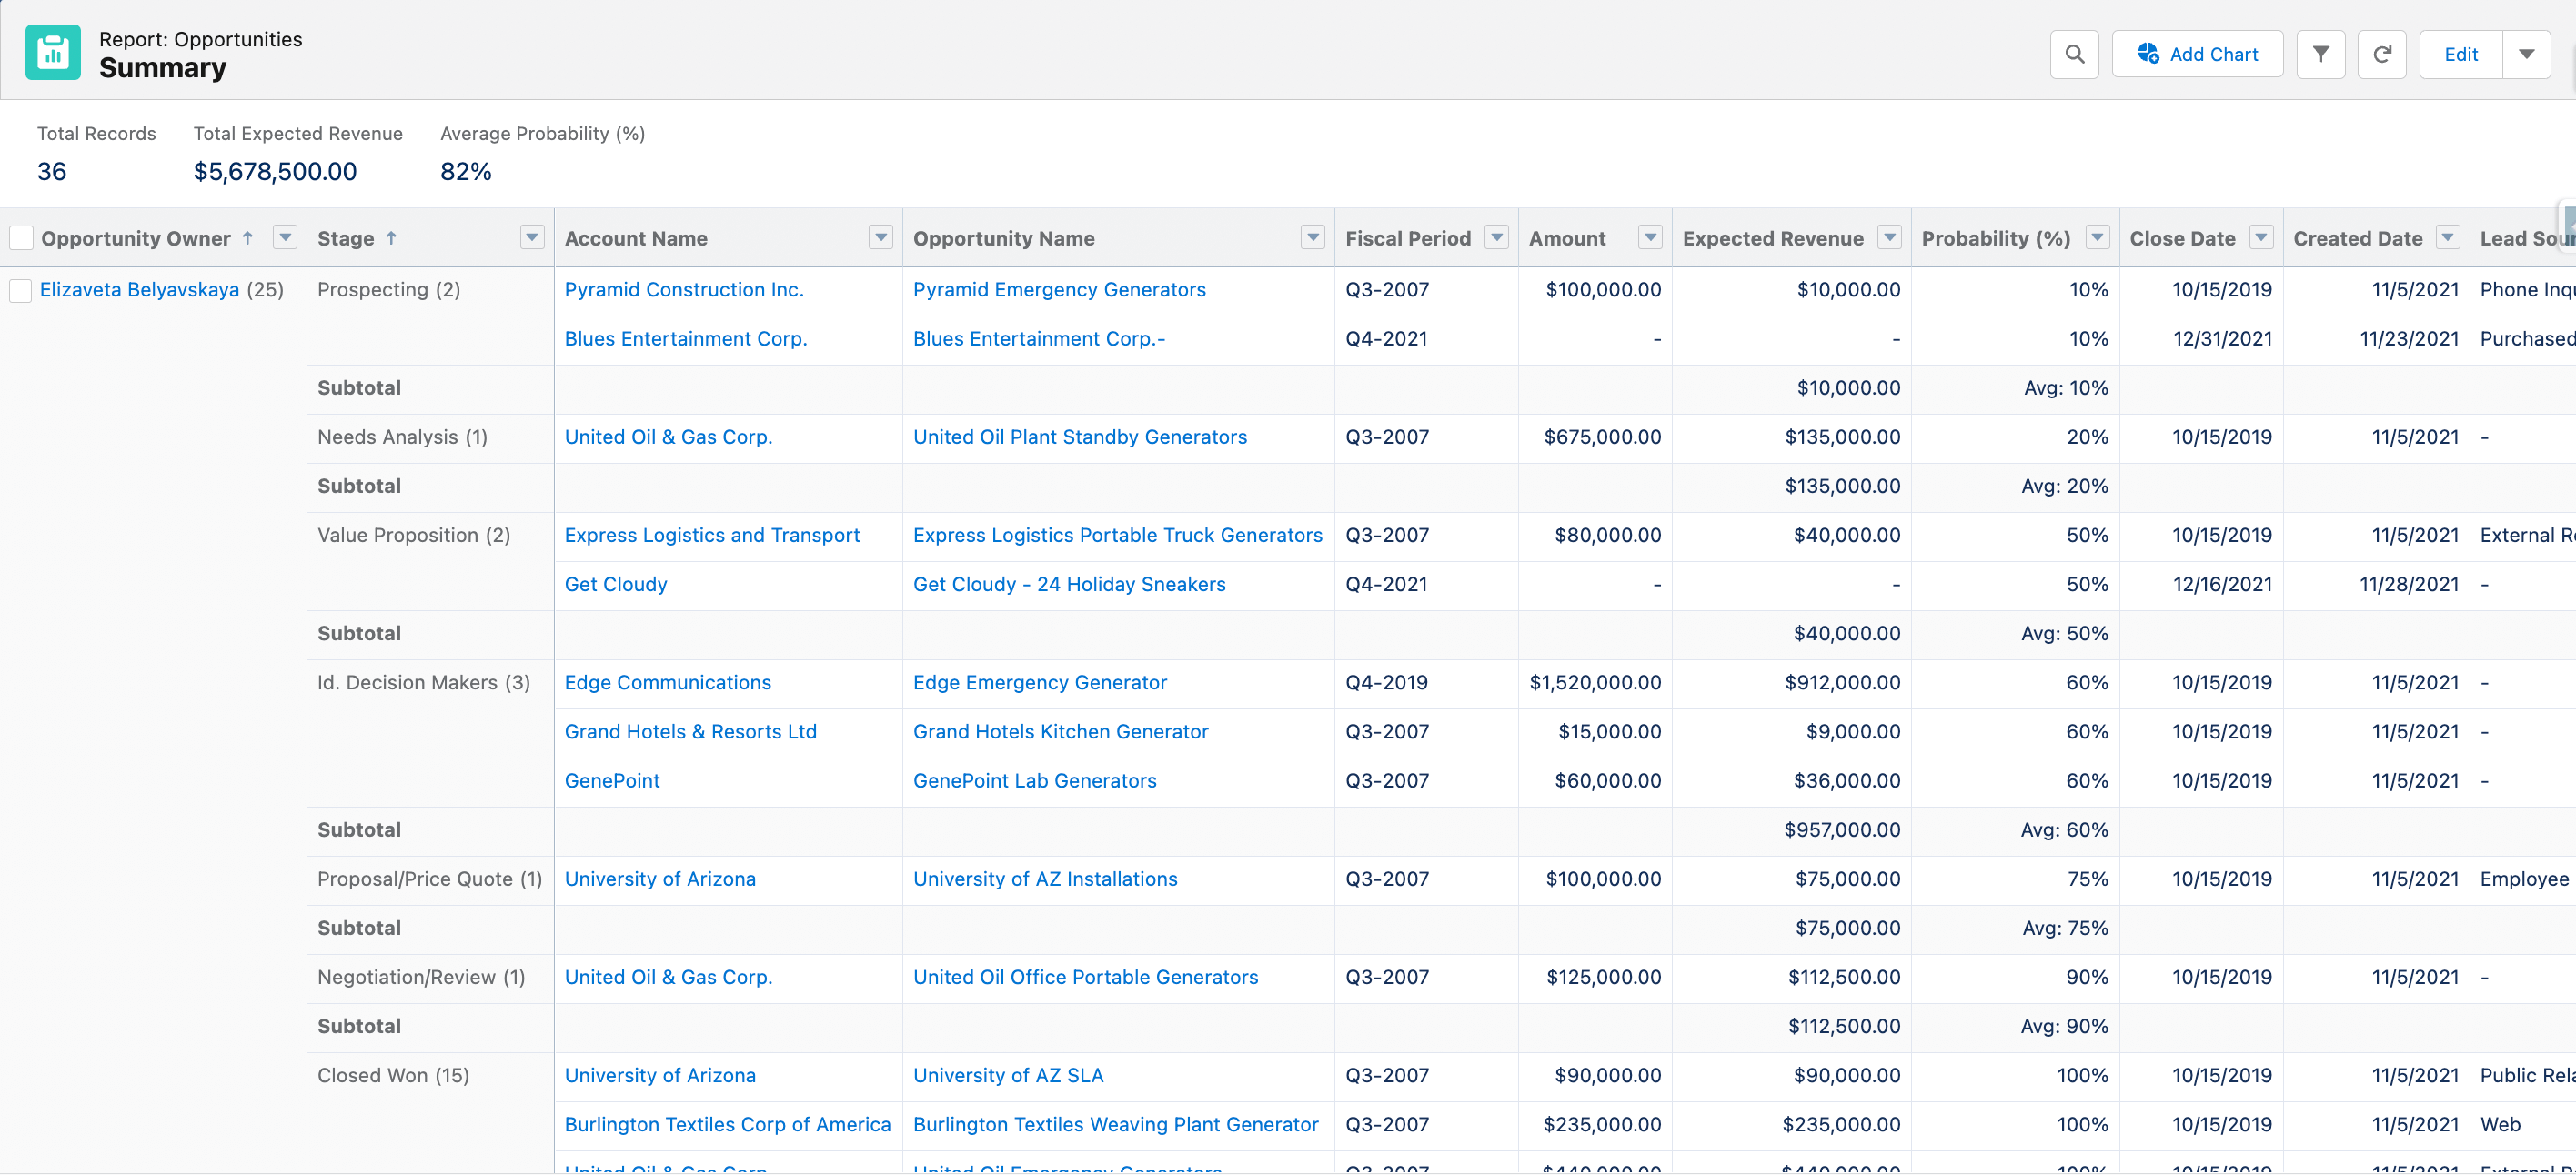
The example of the Summary report. Click here to view the full report
Matrix Reports and Their Use Cases
The next one is the Matrix Report. Matrix reports are similar to pivot tables in Excel. They display data in a grid format with rows and columns that can be summarized by different criteria. Matrix reports are useful for displaying data that needs to be analyzed from multiple perspectives.
For example, you can create a Matrix report to:
- summarize sales data by both product and region
- track service performance metrics, such as response time and resolution rate, by both customer and service agent
- analyze marketing campaign data by both channel and demographic
- track HR performance metrics, such as employee turnover and training completion rate, by both department and manager
- summarize financial data, such as revenue and expenses, by both product and quarter
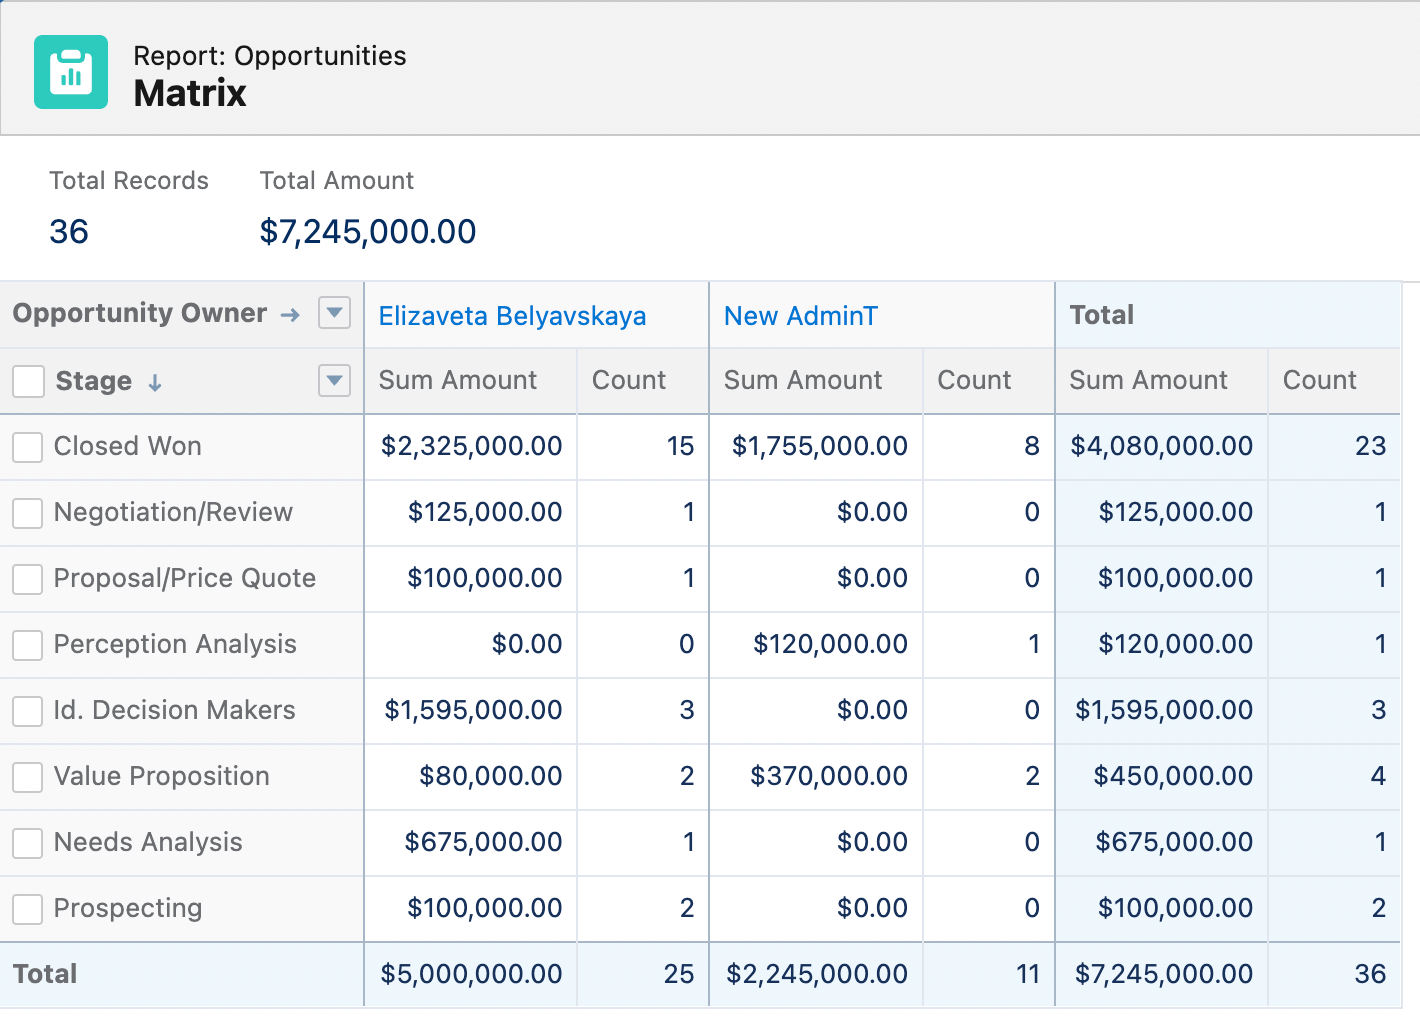
The example of the Matrix report. Click here to view the full report
Joined Reports and Their Use Cases
Joined reports allow you to combine data from multiple report types into a single report. They are useful for comparing data from different sources. For example, a sales manager may use a joined report to display the sales data for each sales representative alongside the number of leads generated by each marketing campaign.
With the help of joined reports, you will be able to combine:
- data from sales by product and sales by sales rep
- service performance by channel and service performance by the agent
- marketing campaign data by channel and conversion rate
- HR performance by department and employee tenure
- financial data by product and financial data by region
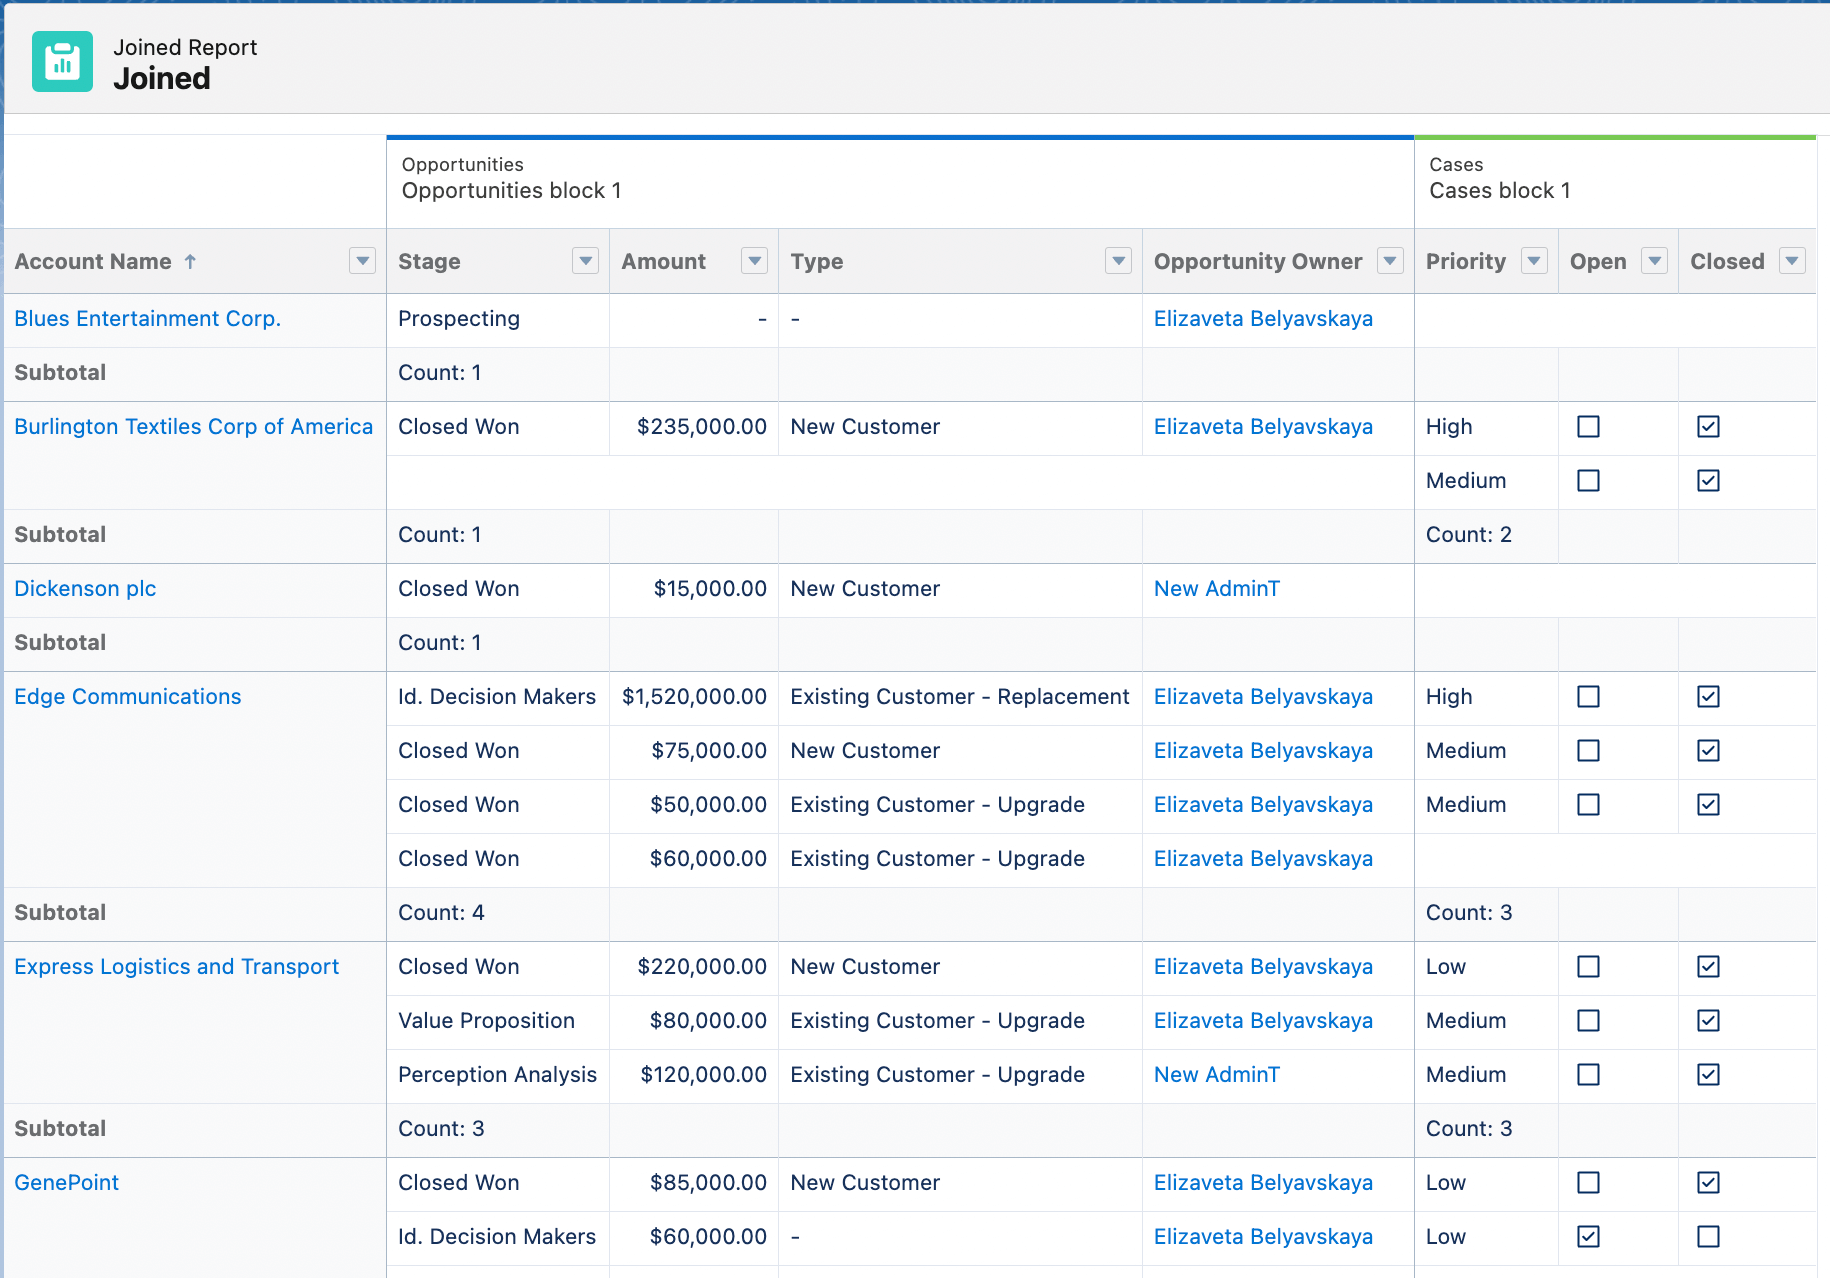
The example of the Joined report. Click here to view the full report
Conclusion
In conclusion, Salesforce reports are essential for businesses to gain valuable insights and make data-driven decisions. Each report type has its own unique use cases and benefits. Tabular reports are great for sorting and filtering data, summary reports are useful for creating subtotals and hierarchically grouped reports, matrix reports allow for analyzing data from multiple perspectives, and joined reports enable the combination of data from different sources.